Perception of a housing crisis

If you’ve watched the news lately, you might get the feeling that the housing market is imploding.  Unfortunately, the talking heads are reporting the titles of the news releases, such as the October 20th National Association of Realtors press release headline “Existing-Home Sales Decreased 1.5% in September,” without delving into the details. Like anything else that’s reported, just parroting a headline doesn’t tell the entire story. Get the big picture and avert the perception of a housing crisis.

perception of a housing crisis
Home price forecast

Here are the highlights of the NAR report: “Existing-home sales sagged for the eighth consecutive month to a seasonally adjusted annual rate of 4.71 million. Sales slipped 1.5% from August and 23.8% from the previous year. The median existing-home sales price increased to $384,800, up 8.4% from one year ago. The inventory of unsold existing homes declined for the second straight month to 1.25 million by the end of September, or the equivalent of 3.2 months’ supply at the current monthly sales pace.”

The takeaway is that yes, existing-home sales have been sluggish (eight consecutive months), however does that mean a housing crash? No. Consider the other important data points included in the news release: the median existing-home sale price increased 8.4 percent year-over-year, AND the inventory of unsold homes continues to decrease.

What’s your perception of a housing crisis ? For many, the memories are still fresh of the housing crisis of 2007 and subsequent foreclosure crisis. So, it’s not surprising that the media’s alarms go off when existing-home sales drop as they did recently. However, the fundamentals of today’s housing market are much different than that of 2008-2010. During the housing crisis of 2007, home sale prices plummeted when home sales dropped. Additionally, inventories of unsold homes swelled to record levels.

Today’s housing market is much different and looking at the entire picture, the stats tell a different story than what is being portrayed by the media. NAR Chief Economist Lawrence Yun chalks up the decline in sales to increasing mortgage interest rates, which are approaching the accepted historical average of 7 to 8 percent.  He also points out “…Despite weaker sales, multiple offers are still occurring with more than a quarter of homes selling above list price due to limited inventory… The current lack of supply underscores the vast contrast with the previous major market downturn from 2008 to 2010, when inventory levels were four times higher than they are today.”

By Dan Krell
Copyright © 2022

Protected by Copyscape Web Plagiarism Detector

Disclaimer. This article is not intended to provide nor should it be relied upon for legal and financial advice. Readers should not rely solely on the information contained herein, as it does not purport to be comprehensive or render specific advice. Readers should consult with an attorney regarding local real estate laws and customs as they vary by state and jurisdiction. Using this article without permission is a violation of copyright laws.
Price is Everything

Price is everything
Home owner equity

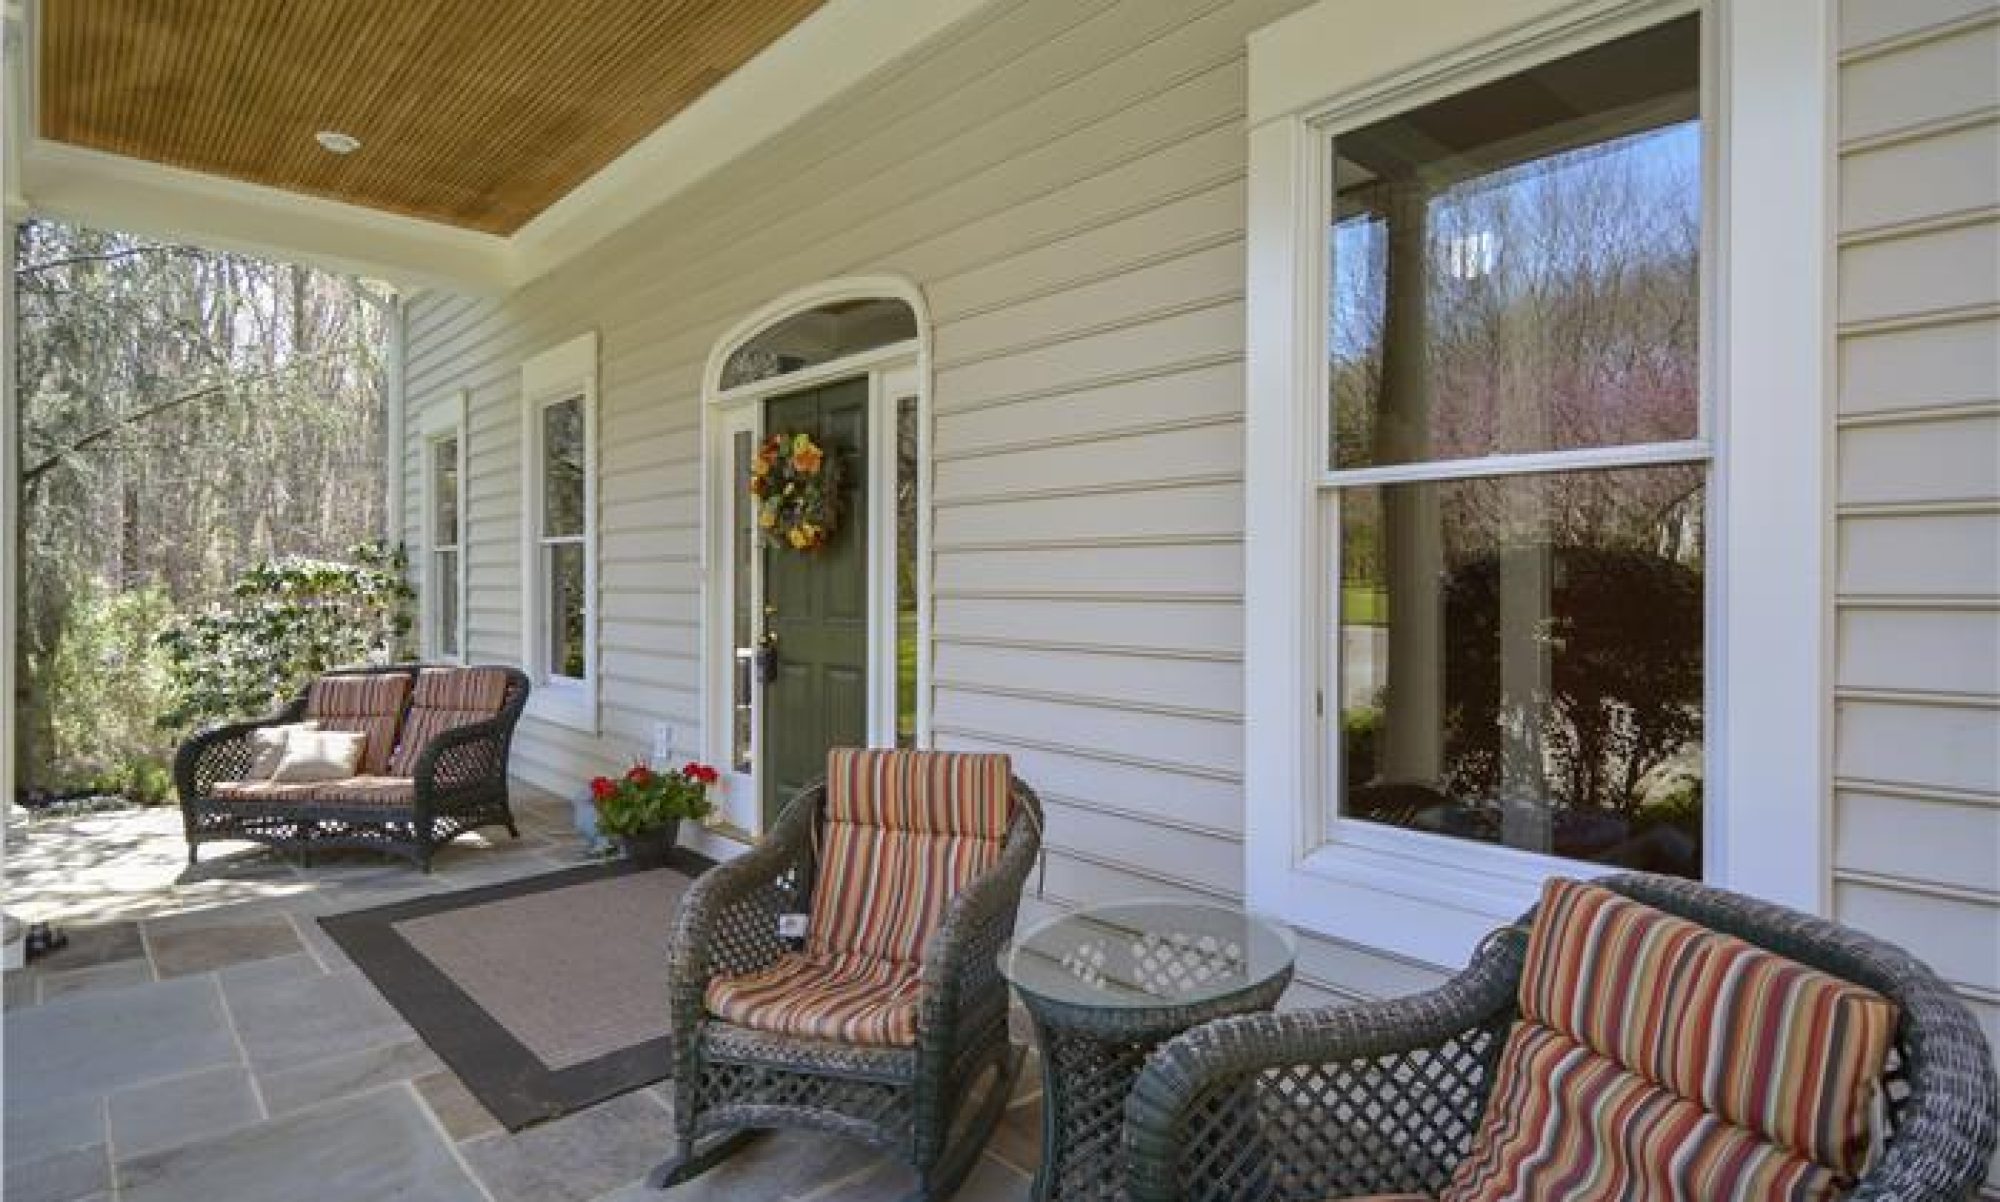
Home sellers want to get top dollar, and home buyers want value.  This is a hard to truth to acknowledge, but regardless of your home’s condition, location, etc. it all comes down to the home sale price.  Don’t just take my word on it. There’s plenty of peer reviewed research on the topic.  For example, Han and Strange’s study that demonstrates how home price effects home buyers’ response and motivation to visit and/or make an offer on your home (What is the Role of the Asking Price for a House?; Journal of Urban Economics; Volume 93, May 2016, P115-130).  The conclusion indicated that list prices that are consistent with neighborhood values (not overpriced) maximize home buyer engagement.  Price is everything .

The “price is everything” concept applies to any housing market.  It applies when the market is slow, and even when the market is doing well.  Take for example this year, when it seemed as if any home that come on the market sold quickly. However, there’s a caveat: homes that were priced correctly sold quickly.  Homes that were overpriced took much longer to sell.  For those overpriced homes that sold, they sold for less than original list price. 

As home prices continue to appreciate, home sellers are eager to push the envelope when setting their list price.  But home buyers are savvy and won’t overpay for a home, so creating a realistic pricing strategy is key to your home sale success.  Things to consider include your home’s condition, your local market, and your competition.

The main tool to help you decide on a list price is the CMA (comparative market analysis), which you can get from your agent.  The CMA is not an appraisal, but it is a snapshot of market activity for similar homes in your market area.  The CMA can show how homes like yours (that are similar in size, style, age and condition) sell by price and days on market.  Typically, the CMA is broken down into 3-month, 6-month, and 12-month segments to show how home sales are trending.  Compare active homes to homes that sold as well as those that didn’t sell for sale price and days-on-market).  Also be aware of any seller concession, which can affect your net sale.  Finally keep track of neighborhood active listings, this is your competition that can also help you modulate your price if needed.

To help sellers understand how their homes compare to the competition, I used to advise clients to visit neighborhood open houses.  This was helpful in understanding how to prepare their homes by comparing the homes’ condition and features.  Although visiting open houses may not be practical for you these days, technology makes it easy to see the interior of home via HD pictures, virtual tours and floor plans. 

Another pricing strategy that many home sellers use to get more buyer traffic is “just-below” pricing.  Just-below pricing is reducing your decided list price below the rounded number.  For example, if your list price is $450,000, the just-below price might be $449,900. This strategy was demonstrated through research by Beracha and Seiler (The Effect of Pricing Strategy on Home Selection and Transaction Prices: An Investigation of the Left-Most Digit Effect; Journal of Housing Research; 2015; Vol. 24, No. 2, pp.147-161).  Just-below pricing works best the list price is rounded down to the nearest hundred or thousand.

Original published at https://dankrell.com/blog/2020/12/20/price-is-everything/

By Dan Krell
Copyright © 2020

If you like this post, do not copy; instead please:
link to the article,
like it on facebook
or re-tweet.

Protected by Copyscape Web Plagiarism Detector

Disclaimer. This article is not intended to provide nor should it be relied upon for legal and financial advice. Readers should not rely solely on the information contained herein, as it does not purport to be comprehensive or render specific advice. Readers should consult with an attorney regarding local real estate laws and customs as they vary by state and jurisdiction. Using this article without permission is a violation of copyright laws.

Home Prices 2021

It’s almost inconceivable to think that the housing market will undergo a foreclosure crisis similar to what we went through back in 2008.  How will home prices 2021 be affected by an impending wave of foreclosures?

home prices 2021
Home Buyer traffic 2020

If you remember, the 2007 housing market peaked as home prices skyrocketed.  Homes were a hot commodity as home buyers and speculators seemingly could not get enough.  But by the fall 2007, as if someone flipped a switch, inventory piled up.  There was a reckoning in 2008 as the market was flooded with foreclosures.  Home prices dropped to the lowest levels in a decade and days-on-market averaged in months.  It took five years for home prices to stabilize and maintain solid gains.

Fast forward to the 2020 lockdowns.  The housing market took off like a rocket during the summer and fall, after taking several months off.  Pent-up demand was the catalyst for record home sales leaving inventory depleted and forced upward pressure on home prices.  Housing is again economy’s workhorse.

A November 19th NAR press release (nar.realtor) touting October home sales indicated that existing-home sales increased 26.6 percent year-over-year!   Additionally, the median existing-home sale price increased 16 percent year-over-year.  All this occurred as home sale inventory levels are historically low.  Interestingly, it was noted that about 70% of homes sold during October, which means not all homes sold.

Additionally, October’s pending home sales point to a strong market into 2021.  The NAR’s October Pending Home Sale Index indicated that although new contracts declined a slight 1.1 percent from September to October, the year-over-year new contracts increased about 20 percent!

With stats like this, many industry experts are expecting a strong housing market and increased home prices 2021.  The high expectations for the housing market is demonstrated by a December 3rd HousingWire report (housingwire.com) titled, “Even with low inventory, expect a strong 2021 housing market.

home prices 2021
Home Sale Inventory 2020

And as many celebrate this hot housing market during a global pan-demic, some are raising concerns about the many home owners who are delinquent on their mortgages.  Unfortunately, delinquent mortgages haven’t received as much coverage as it probably should have.  Many home owners are unable to stay current on their mortgages due to lock-down job cutbacks.  As a result, some are expecting a surge in foreclosure notices.

An October 13th CoreLogic press release indicated that the July mortgage delinquency rate (30 days or more late) was 6.6 percent.  Although the rate slightly dropped from June’s 7.1 percent, serious delinquencies (90 days or more past due) jumped to 4.1 percent (compared to 1.3 percent a year earlier).  Serious delinquencies are the highest since April 2014.  Troubling is that mortgages which are 120 days or more late surged to 1.4 percent – which is a 21-year high, eclipsing the 2009 peak!  The metropolitan areas experiencing the highest delinquency rates are those where home price increases made the most gains (such as New York, Miami, Las Vegas, and Houston). 

So, what does this mean?

An August 27th CoreLogic report made a case for declining home prices in 2021.  There’s no denying it, there is a foreclosure wave waiting in the wings.  It’s unclear when the foreclosures will occur because of the current pan-demic moratorium.  However, if foreclosures are as numerous as they were in 2008, home prices 2021 will likely decline when these homes come to market.

By Dan Krell
Copyright © 2020

Original located at https://dankrell.com/blog/2020/12/05/home-prices-2021/

If you like this post, do not copy; instead please:
link to the article
like it on facebook
or re-tweet.

Protected by Copyscape Web Plagiarism Detector

Disclaimer. This article is not intended to provide nor should it be relied upon for legal and financial advice. Readers should not rely solely on the information contained herein, as it does not purport to be comprehensive or render specific advice. Readers should consult with an attorney regarding local real estate laws and customs as they vary by state and jurisdiction. Using this article without permission is a violation of copyright laws.

Home Prices and Safety

home prices and safety
home sales snapshot (infographic from nar.realtor).

Home buyers have various criteria when searching for a home.  Some are concerned with schools, while others may be interested in a house’s proximity to mass transit.  However, one of the top items home buyers consider when buying a home is neighborhood safety. Which begs the question, Is there a correlation between home prices and safety?

Home buyers don’t have to justify their preference for a safe neighborhood.  However, concern for neighborhood safety go beyond protecting their families, it is also a consideration to protect the financial investment in their homes.  And a rich body of research validates home owners and buyers concern for neighborhood safety by documenting correlations of crime and home values. 

Research about home prices and safety

An early influential study connecting home prices and safety was conducted by Sheila Little in 1988, which investigated the effect of crime on property values (Effects of Violent Crimes on Residential Property Values; Appraisal Journal; 1988, Vol. 56 No. 3, p341-343).  Little discussed an appraiser’s duty to consider violent crime when determining property value.  Because property disclosure has is onerous, material facts such as violent crime must be considered in the valuation process.  She stated; “It is part of appraisers’ responsibilities to make an effort to ascertain the effects of violent crimes on market value of properties.” 

Another study looking at home prices and safety was published by Allen K. Lynch and David W. Rasmussen (Measuring the impact of crime on house prices; Applied Economics, 2001, 33, p1981-1989). They found that when weighted over a large metro area, crime per-se doesn’t have a significant impact on the average metro home sale price.  However, they did find that “house values decline dramatically in high crime areas.”  Besides being identified through statistical means, high crime areas may also be perceived as such because of relative juxtaposing of neighborhoods.  The authors suggest that localities can reduce loss of tax base by “reducing the probability of neighborhoods crossing the high crime threshold.”

A 2010 study by Keith Ihlanfeldt &Tom Mayock looked at seven types of crime and the effects on home prices (Panel data estimates of the effects of different types of crime on housing prices; Regional Science and Urban Economics, 40; 2–3, May 2010, p 161-172).  They concluded that robbery and aggravated assault had “meaningful influence” on property values.

A 2009 study concluded that home owners respond to crime by moving (Hipp, Tita & Greenbaum; Drive-Bys and Trade-Ups: Examining the Directionality of the Crime and Residential Instability Relationship; Social Forces; 2009, Vol. 87, No. 4, pp.1777-1812).  Besides discovering that violent crime significantly increases home sales the following year, the authors also found evidence of a downward trend of home sale prices for the same time period.

Not all home owners decide to move, as remaining residents can stabilize their neighborhood.  Galster, Cutsinger, and Lim concluded that communities are self-regulating and can adjust over a long period of time (Are Neighbourhoods Self-stabilising? Exploring Endogenous Dynamics; Urban Studies; 2007, Vol 44, No.1, pp. 167-185).  Stabilization takes “considerably longer” if the shock to the community is substantial. They concluded there are social, economic, and/or political reactions to neighborhood crime.

If you’re buying a home, it’s unlikely that your real estate agent will provide answers about neighborhood safety (because it may be construed as steering and a violation of fair housing laws).  However, you should contact the local police precinct and ask questions to make your own determination of neighborhood safety.  It’s also a good idea to talk to your potential neighbors. You can also view additional metro crime data compiled by the FBI (fbi.gov).

Original article is published at https://dankrell.com/blog/2019/12/10/home-prices-and-safety/

By Dan Krell
Copyright© 2019

If you like this post, do not copy; instead please:
link to the article,
like it on facebook
or re-tweet.

Protected by Copyscape Web Plagiarism Detector

Disclaimer. This article is not intended to provide nor should it be relied upon for legal and financial advice. Readers should not rely solely on the information contained herein, as it does not purport to be comprehensive or render specific advice. Readers should consult with an attorney regarding local real estate laws and customs as they vary by state and jurisdiction. Using this article without permission is a violation of copyright laws.

iBuyers are Just House Flippers

Disruption in the marketplace seems to be the standard these days. So, it should not come as a surprise that the iBuyer phenomenon has taken hold of the real estate industry and is expanding.  What started out as an experiment in limited markets has grown into the internet version of “I Buy Houses.” (You’ve probably seen the “I Buy Houses” bandit signs around town.)  Nonetheless, iBuyers have become the trendy and acceptable version of house flippers.

According to Zillow, an iBuyer is “…a real estate investor that uses an automated valuation model (known as an AVM) and other technology to make cash offers on homes quickly.”  And although Zillow’s explanation of the iBuyer model describes that the home gets sold to the investor sight unseen, many will actually visit your home before finalizing the deal.

Automated valuations are helpful but not always accurate. Additionally, investors typically apply their AVM derived value into a formula to produce their offer price. Because they are akin to the Pawn Shop of the real estate industry, where they have to build in a profit for them, house flippers usually offer 70-75% of retail value (after repairs).

House flipping by any other name is still house flipping.  But the iBuyer trend has put a shiny veneer to the business.  The model allows for anonymity, at least initially, by giving you an offer to buy your home just by completing a form.  However, just like traditional real estate investors, iBuyer representatives will visit the home to confirm the accuracy of the reported home’s condition and other vital facts. 

If you’re looking to get top dollar on your home, you’re probably going to be disappointed with the iBuyer offer (or any real estate investor offer for that matter).  However, you might be willing to accept a lower offer on your home for a quick closing and selling “as-is.”  The desire of convenience of selling to real estate investors is confirmed by ATTOM Data Solutions 2018 Year-End Home Flipping report that indicated “207,957 U.S. single family homes and condos were flipped in 2018” (attomdata.com).  Although house flipping is down four percent from 2017, the numbers indicate a continued willingness by home owners to deal with house flippers. 

Don’t think you’re escaping the 6 percent commission when selling to iBuyers.

Patricia Mertz Esswein wrote recently that the iBuyer convenience comes at a cost (Kiplinger’s Personal Finance. April 2019, Vol. 73 Issue 4, p12).  She explained that iBuyer service fees range from 6 to 13 percent, which exceed Realtor commissions that typically range in today’s market from 3.5 to 5 percent!

Currently, most iBuyers are exclusive to specific markets that make the model financially sound.  However, new iBuyer companies are throwing their hats into the ring and expanding the model in new markets nationwide.  An article from the California Association of Realtors’ magazine (The Era of iBUYERS?; California Real Estate. September 2018, Vol. 98 Issue 6, p22-25) discusses the pros and cons of iBuyers and explains that the phenomenon is still in its “infancy.”  Meaning that iBuyer companies are still cautiously expanding in hot markets.  Furthermore, you should be wary of real estate brokers who engage in making iBuyer (or similar) offers as part of their listing service because it could be in conflict of their fiduciary duties to you.  

If you’re wanting to get top dollar on your home, you probably will go the traditional route and list on the MLS.  But, if you’re looking for a quick sale, explore all of your options.  Solicit and compare iBuyer offers to local real estate investor offers.  Also, consult with several real estate agents to not only get a picture of your home’s value, but they may have buyers for your home too. 

Original published at https://dankrell.com/blog/2019/05/13/ibuyers-are-just-house-flippers

By Dan Krell
Copyright © 2019

If you like this post, do not copy; instead please:
link to the article
like it on facebook
or re-tweet.

Protected by Copyscape Web Plagiarism Detector

Disclaimer. This article is not intended to provide nor should it be relied upon for legal and financial advice. Readers should not rely solely on the information contained herein, as it does not purport to be comprehensive or render specific advice. Readers should consult with an attorney regarding local real estate laws and customs as they vary by state and jurisdiction. Using this article without permission is a violation of copyright laws.